
On June 2nd, CMS distributed the 1st quarter 2017 SNF Quality Reporting Program (QRP) Review and Correct Reports. These reports contain quality measure information for the 3 SNF QRP measures currently in play in the SNF QRP:
- Percent of Patients or Residents with Pressure Ulcers that are New or Worsened
- Percent of Residents Experiencing One or More Falls with Major Injury
- Percent of Long-Term Care Hospital Patients with an Admission and Discharge Functional Assessment and a Care Plan that Addresses Function
Since these reports have come out, a couple of the most common questions I have received is what does this all mean? Are my numbers good? etc. Let’s take a closer look at these reports and try to understand the information that is being provided to us.
General Overview of Reports
There are three different Review and Correct reports available, one for each of the SNF QRP measures. Each report contains the same type of information in 3 distinct sections:
- The Header section
- The SNF Quality Measure Title and ID section
- The Table Legend.
Sections 1 and 2 are relatively self-explanatory so we will spend the remainder of the time reviewing the data provided in the Table Legend.
The Table legend contains 8 columns of information:
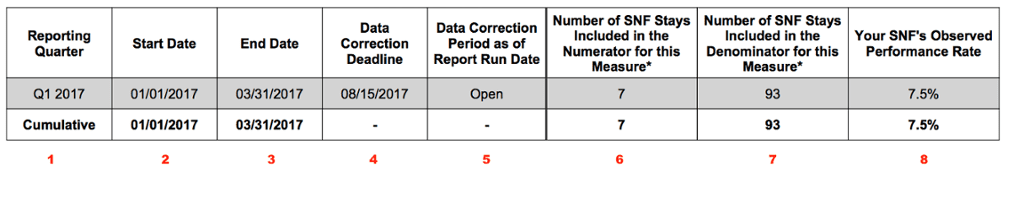
Column 1: Reporting Quarter, identifies the quarter for which data was collected.
Columns 2 and 3: Quarter Start and End Dates, in this case 1/1/17 – 3/31/17.
Column 4: Data Correction Deadline, cutoff date to correct and submit any MDS corrections impacting the measure.
Column 5: Data Correction Period: Let’s you know if the current correction period is still “open” or “closed”
Column 6: Number of SNF Stays – Numerator: The numerator is the actual number of resident SNF stays that did qualify for the respective QM.
Column 7: Number of SNF Stay – Denominator, the denominator represents the total pool of SNF stays during the quarter reviewed. This is the total number of SNF stays that could have qualified for the QM.
Column 8: SNF’s Observed Performance Rate, the percentage of SNF stays during the quarter that qualified for the QM. This is a simple mathematical calculation of dividing the numerator by the denominator.
Let’s take a closer look at each of the SNF QRP QMs by looking at some actual report data.
Residents with Pressure Ulcers that are New or Worsened
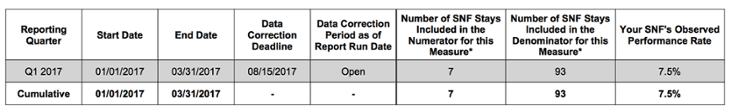
This QM is identifying the percentage of residents who either develop a pressure ulcer during their Part A SNF stay or residents who were admitted with a pressure ulcer that worsened in stage during their Part A SNF stay.
For this facility, we can determine they had a total of 93 SNF Part A stays during the first quarter of 2017. Out of the total 93 stays, 7 resident stays resulted in a pressure ulcer that was new or worsened. This resulted in a facility observed performance rate of 7.5%. (7/93 = .0752 or 7.5%). For this measure, a lower SNF Observed Performance Rate would be desired.
Residents Experiencing One or More Falls with Major Injury
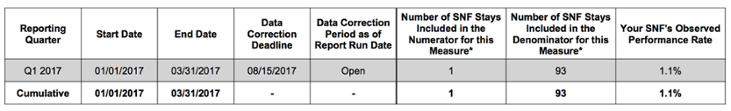
This QM is identifying the percentage of residents who experienced one or more falls with major injury during their SNF Part A stay.
For this facility, we can determine that they had a total of 93 SNF Part A stays during the first quarter of 2017. Out of the total 93 stays, 1 resident stay resulted in a fall with major injury. This resulted in a facility observed performance rate of 1.1%. For this measure, a lower SNF Observed Performance Rate would be desired.
Patients with an Admission and Discharge Functional Assessment
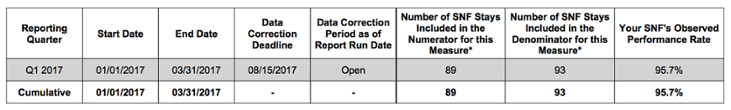
This QM is identifying the percentage of residents whose functional status was appropriately assessment upon admission, at least one discharge goal was established, and their functional status was assessed upon discharge from the Medicare Part A stay for planned discharges. This QM utilizes the new Section GG of the MDS 3.0.
For this facility, we can determine that they had a total of 93 SNF Part A stays during the first quarter of 2017. Out of the total 93 stays, 89 met all the criteria for the QM which resulted in a SNF observed performance rating of 95.7%. For this measure, a higher SNF Observed Performance Rate would be desired.
What Do I Do with These Reports?
The $64,000 question! As indicated by the title of the reports, the reports are being provided to SNF organizations to allow them to “review and correct” their report data. This would require SNFs to review each of the SNF QRP reports and decide if the data presented appears to be accurate for their facility. Since the reports do not provide any resident level data this process could be somewhat onerous.
Using the examples shown above, some of the questions you should ask may be:
- Is the total number of SNF stays (93) accurate? If this does not appear correct, are you missing any entry tracking forms and discharge assessments?
- Does the SNF Observed Performance Rate appear too low or too high for your organization?
- Review the numerator for each of the QMs. Can you identify the 7 residents who either developed or had a worsening in their pressure ulcer during their Medicare Part A stay? Is this data accurate?
- Can you identify the 1 resident that had a fall with Major Injury? Is this accurate?
- Why are their 4 residents that did not meet the Functional Assessment QM criteria? Can you identify who the 4 residents are? Is this data accurate?
- Do any MDS items used in the proper calculation of the QM contain “dashes”. Find out more
- Review any MDS assessments associated with residents that may have raised questions? Are the MDS items pertaining to each of the QMs accurately coded?
If corrections to any MDS assessments must be made make sure to follow the appropriate MDS correction process and have all identified MDS assessments corrected, submitted and accepted prior to the data correction deadline.
Looking for a next step? Register for our upcoming free webinar entitled, Training and Development to Deliver Measurable Results, and learn how to mitigate risk and improve outcomes.