
The SNF Value Based Purchasing (VBP) program is scheduled to be implemented on 10/1/2018 (FY2019) and all providers will realize some level of change to their overall SNF PPS reimbursement.
2% Across the Board Decrease in SNF PPS Rates
Section 215 of the “Protecting Access to Medicare Act of 2014” (PAMA) requires a 2% reduction in SNF Medicare payments. The monies withheld will be used to fund the incentive payments associated with the VBP. 50 – 70% of the funds banked from the 2% across the board SNF rate reduction must be awarded back to the SNF Industry via Value Based Purchasing program incentive payments.
Incentive payments will be determined based on a SNF’s performance in relation to the 30-Day All Cause Readmission Measure (SNFRM) score in calendar year 2017 (CY2017), referred to as the “performance period” compared to 2015 (CY2015), the “baseline period”. Each SNF’s incentive payment will be based on either the SNF’s Achievement Score or Improvement Score, whichever is higher:
To have a better understanding of how the Achievement Score and Improvement score will be calculated, we need to review a few definitions:
SNF VBP Definitions
| Achievement Threshold | The 25th percentile of national SNF performance on the QM during CY 2015. |
| Benchmark | The mean of the best decile of national SNF performance on the QM measure during CY 2015. |
| Benchmark | The specific SNFs performance on the specified measure during CY 2015. |
| Performance Period | CY 2017 |
| Baseline Period | CY 2017 |
| SNFRM Inverted Rate | CMS will determine the SNF Inverted Readmission. Example: A 20% (.20) readmission rate, will actually be reported as 80% or .80. |
Calculating a SNFs Improvement Score
A particular SNFs improvement score is based on comparing the particular SNFs readmission performance between the 2015 Baseline Period and the 2017 Performance Period. Based on the comparison of these two periods a SNF will be awarded an Improvement Score between 0 – 90 points.
- If the SNFs rate in 2017 is better than or equal to the benchmark, then the full 90 points will be awarded;
- If the SNFs rate is worse than the improvement threshold, then 0 points will be awarded.
- If the SNFs 2017 rate falls between the improvement threshold and the benchmark, then 1-89 points will be awarded based on a set formula established by CMS.
Calculating a SNFs Achievement Score
A SNFs Achievement Score is based on comparing the SNFs specific rating during the performance period (CY 2017) with the performance of ALL facilities nationally during the CY 2015 base line period. Based on this comparison, a SNF will be awarded an Achievement Score between 0 – 100 points.
- If the SNFs rate is better than or equal to the benchmark, then a full 100 points will be awarded.
- If the SNFs rates is worse than the achievement threshold, then 0 points will be awarded.
- If the SNFs rate falls between the achievement threshold and the benchmark, then 1 – 99 points will be awarded based on a set formula established by CMS.
Improvement Score vs. Achievement Score Case Study
Data Elements:
- Achievement Threshold = 0.79551
- Benchmark =.83915
- 2015 Performance (Improvement Threshold): .78756
- SNF 2017 Performance = .81668
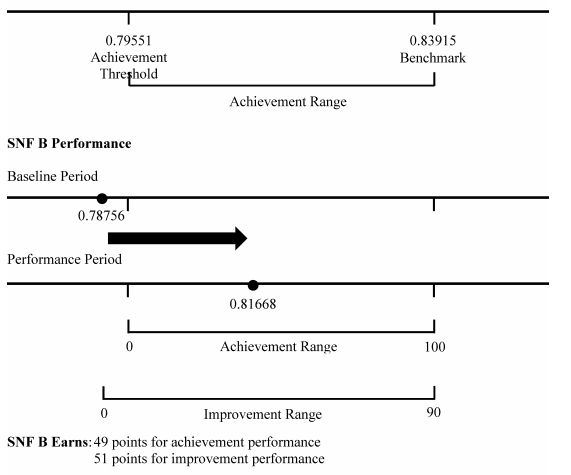
In this case example, since the 2017 inverted readmission rate falls between the achievement threshold and the benchmark, 49 points were awarded for the achievement performance, based on CMS’ specific formula. In addition, since the 2017 inverted readmission rate was greater than the 2015 baseline performance (performance threshold) but less than the benchmark, they were awarded 51 improvement points based on CMS’ specific formula.
The improvement score of 51 points will be used to determine the SNF’s incentive payment amount since this was the higher of the two scores calculated. CMS will be issuing further guidance on how incentive payments will be calculated in future rulemaking.
Minimizing Impact of 2% Reduction
The SNF industry as a whole has focused on rates of hospital readmission for the past several years. Data, as presented by CMS, indicates a year over year decrease from 2013 -2015. This data also indicates that if comparing 2013 (baseline) to 2015 (performance period) approx. 78% of nursing facilities would receive an achievement score and 56% would receive an improvement score.
If the readmission rates continue the downward trend during 2016 and particularly 2017, the next “performance period”, it would seem logical to deduce that the number of nursing facilities receiving an achievement score and/or a performance score is also likely to increase. SNF providers need to continue to focus their efforts, during 2017, on minimizing overall hospital readmissions to optimize their incentive payments thus minimizing the financial impact of the 2% payment reductions slated for 10/1/2018.
Looking for more information on this topic? Download our on-demand webinar.